In project management, there is a term named “Earned Value.” It prevents the value your project has actually earned based on its current state of completion. The graphics below help describe this.
A close relative to Earned Value is Planned Value. It is the monetary value the project should have generated at any point in its state of completion. Ideally, Earned Value and Planned Value should be identical.
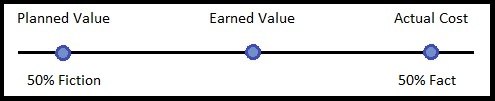
And another close relative is Actual Cost. It is the cost the project has incurred at its current state of completion. When Earned Value and Planned Value and Actual Cost are all equal, the planets have aligned! But when they are not, we have discrepancies which we’ll explore below. That may help explain the post title: “Earned Value: 50% Fiction and 50% Fact”.
The 50% fiction is Planned Value. The 50% fact is Actual Cost. Earned Value is somewhere in the middle.
Here is an example of a discrepancy between Earned Value, Planned Value, and Actual Cost. The Earned Value is much less than we expected, and the Actual Cost is much more.
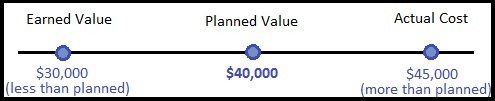
In this example, we see Earned Value at $30,000, but it should be $40,000. We also see the actual costs on the project to be $45,000. It turns out there are calculations to help normalize and judge the value of these numbers. This let you compare the numbers with other projects to see how close you have come to historical numbers. If you miss the Planned Value mark, the difference is called a variance. Variance simply means you varied from your target by some amount. There is a schedule variance and cost variance. Of course ideally, we want these to be zero.
Schedule Variance (SV) is Earned Value minus Planed Value. Cost Variance is Earned Value minus Actual Cost. The equation is below.
SV = EV – PV ($30,000 – $40,000 = -$10,000)
CV = EV – AC ($30,000 – $45,000 = -$15,000)
In addition to variance, you can view the discrepancies in terms of ratios. They are actually more helpful to compare with other projects because they normalize all the numbers to a single comparable performance value.
The Cost Performance Index is the ratio of Earned Value to Actual Cost. The Schedule Performance Index is the ratio of Earned Value to Planned Value.
CPI = EV / AC ($30,000 / $45,000 = .67)
SPI = EV / PV ($30,000 / $40,000 = .75)
Any Cost Performance Index number over 1 is over budget. Any Schedule Performance Index over 1 is “over schedule.” See how these performance numbers could be helpful?
In this case, the Cost Performance Index is 67% efficient. In other words, the project made 67 cents for every dollar expected. That’s not good. But maybe the next project will be better!
�