Define: Resource Breakdown Structure (RBS)

Resource Breakdown Structure (RBS): A hierarchical listing of resources necessary to complete a project.

Project resources are commonly thought of human resources only.  In other words, only the people that will actually work on the project tasks.  But that is not necessarily the only type of resource list that can be compiled.  In fact, the RBS can include both human resources and physical resources, like computers, software programs, timesheets, tools, instruments, automobiles, or even special clothing.

As seen below, the hierarchy is entirely project defined.  Any leveling applicable to the project can be used.  Examples might be organizational chart, or tool type, or physical location, or even sequencing by use.  Any useful project breakdown is appropriate.

Traditionally, only non-expendable resources are included.  Expendable items such as water and gasoline would not be listed.  These would fall into the category of supplies rather than resources.

Example of hierarchies of resources:

1. Engineering
  1.1 Rob
                2.2 Ted
                1.3 Software
                                1.3.1 Bill
                                1.3.2 Joe
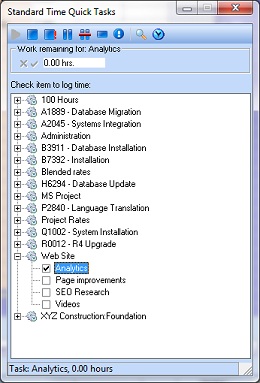
                                1.3.3 Standard Time® Timesheet (timesheet and project tracking software)
                                1.3.4 Microsoft Project (project scheduling)
                                1.3.5 SQL Server (database)
                1.4 Hardware
                                1.4.1 Alice
                                1.4.2 Jill
                                1.4.3 Test Stand A
                                                1.4.3.1 Computer
                                                1.4.3.2 Wiring harness
                                1.4.4 Test Stand B
                                                1.4.4.1 Computer
                                                1.4.4.2 Wiring harness
 

The example above includes both human and inanimate physical resources, like software and test instruments.

Notice the numbering nomenclature.  The hierarchical list is numbered, with each indented layer adding another level to the numerical label.  Examples: 1.3, 1.3.1.  This makes each resource uniquely identifiable by numerical label.

How Buggy is your Product?

Want a really slick way to find out how buggy and nasty your product is? Buggy? Who wants to know that? We want good products, not buggy ones. Well, this method will help you get there. It’s a way to find out how many bugs there are still in your software when you release it.
Let’s face it, all products have bugs. Even fully released and supported ones. But managing the number of bugs at launch time is a good thing. Release too many, and you’re dead. Tech Support will hate you; your CFO will hate you, and worst of all, your customers will hate you. So clean things up, buster!

Here’s how you do it:

Let’s first start by supposing that you have a QA department testing your product prior to release. They test the documented and “undocumented” features of the product, record and report the bugs, then retest when engineers fix them. Hopefully, the product becomes more robust as the release date approaches. Less and less bugs are found. But we all know the product will ship with some known and unknown bugs. You just can find them all, and you can’t always fix the ones you find. But the process is good, and it’s working fine.

So, what if you intentionally slipped some known bugs into the product, hoping the QA department would find them? If you did, you’d know they were doing their jobs. After all, that’s what they are paid to do. So for instance, if you were receiving 1,000 bugs per week from the QA department, and you slipped 100 new bugs into it, you would hope to get 1,100 bugs the next week. You would know the Quality Assurance department was catching 100% of the bugs in the product.

But what if the QA department only found 70 of your artificially injected bugs? I.e. the ones you inserted just to test the percentage of bug found. If only 70 of the inserted bugs came out, that would tell you that their efficiency rate is about 70%. Given that they find 1,000 bugs per month, you might suspect there are actually 1,428 in the system. Why? Because they only found 70% of your artificial bugs, so what makes you think they are finding 100% of the others? Probably not, but that’s okay; nobody’s perfect. If they are 70% efficient, then 1,428 x 70% = 1,000.

Using this method, as your bug rate approaches zero, you’ll know about how many uncaught bugs remain.

Closer to the Source

The sooner employees record actual hours worked, the more accurate they will be.  Some companies require team members to record their project hours.  Sometimes this is for client billing, other times for engineering or manufacturing projects.  Whatever the reason, I’ve seen firsthand that recoding hours soon after the actual event ensures accuracy.

Most people cannot remember what they did last week.  So if asked to fill in their timesheet for last week, they will not be able to pick out individual tasks.  Sure, they remember which projects they worked on, unless there are more than two.  But they cannot reliably remember which tasks.  It gets impossible when asked to assign actual hours to those tasks.  That is the primary reason DCAA (Defense Contract Audit Agency) requires timekeeping every day.  Even filling out timesheets at the end of the week is against the rules.  I don’t normally like government agencies, but in this case there is truth to their overbearing policies.

Standard Time® is an example of a professional timesheet with a built-in timer.  The image below illustrates the Quick Task window.  A link to a video is also included.

Prototype

Standard Time® Quick Tasks

In the Standard Time Quick Task window, you simple click project tasks to start and stop the timer.  Time log records are automatically entered into the timesheet.  That solves the problem of entering hours after the work is finished.  Actual work is sent directly to the timesheet; there is no delay.  And since you are clicking the checkbox to start and stop a timer, the actual work is as accurate as it could possibly be.

Most companies do not require minute-by-minute accuracy, unless you are charging them for time worked.  Only consulting companies really need this level of granularity.  For them, it’s much easier to justify invoices when the time accounting accuracy is beyond impeachment.  Simply print out the actual time log report (with records down to the second) and there is no disputing the accuracy.  Of course you can still milk the clock, but consultants are rarely accused of that.  But still most manufacturing companies that track projects for earned value purposes don’t need timer accuracy.

Whether your company needs timer accuracy, daily accuracy, weekly, or monthly, tracking time is almost always a good thing.  There is so much value in knowing how much time projects take.  Consider a few good reasons: comparing estimates to actuals, estimating future projects, assigning cost and estimates to new activities, or even know what employees are up to – all good things!

When to Re-baseline Your Project

Baselining is the act of recording your original project estimates so you can compare them to actual results at a later time.  It is also the platform from which the project is conducted.  In other words, the baseline contains schedule and cost numbers used by the project team throughout the entire process.  By baselining the project, you are laying the foundation on which the project will rise.  That’s a nice thing to have.  Employees want a good solid plan that doesn’t wander from whim to social whim.  They want a visible goal that isn’t ducking and weaving out of sight every week.  Such a goal offers reassurance and confidence for success.  A moving target is the worst motivation killer known to man.

But sometimes you just need to start over.

Yes, a moving target is a sure killer.  But there are times when the baseline is just crap.  The schedule has become irrelevant, costs are laughable, and the project team is floundering in a sea of mud.  Nothing is going as planned.  Designers are throwing in new requirements that were heretofore unheard of.  Executives are MIA.  And managers have you working 80 hour weeks to hit a target they have no clue of the purpose of.  Nobody’s admitting they’re stupid, but it’s obvious everybody is.  It’s only years later that everyone can look back and shake their heads at the calamity.  But while you’re in the midst of it, you just keep buggering on.

It is those times that executives, or maybe a strong-willed project manager needs to step in and call a hiatus.  But who’s got the guts for that.  Again, you’ve got to be a strong person to blow the whistle and wave your arms.  But if you can recognize the signals, a re-baselining during a mess like this may be your only option.

I was on a two-year software death-march like this.  It was a disaster.  Nobody knew the warning signs.  Nobody blew the whistle.  Nobody re-baselined.  The product failed six months after release, which was at that time a year overdue and marketplace irrelevant.  It was the worst project I was ever on.

Here is a good rule of thumb for knowing when to rebaseline:

Baseline the project if you have missed over half your scheduled targets in the last six months.

Have you missed a few end-to-end tests?  Missed a customer drop or two?  How about a major milestone?  Missed a target feature?  These are the warning signs.  Again, if you have missed over half your targets in the last six months, rebaseline.  Don’t try to figure it out, just baseline the project again.

In fact, in cases like that above I would suggest cutting the scope in half.  Cut the project into smaller phases.  Get the schedule down to visible goals.  And if anybody disputes them, cut them again.  And then again.  You must have realistic goals or you will fail every time.

Earned Value: 50% Fiction and 50% Fact

In project management, there is a term named “Earned Value.”  It prevents the value your project has actually earned based on its current state of completion.  The graphics below help describe this.

A close relative to Earned Value is Planned Value.  It is the monetary value the project should have generated at any point in its state of completion.  Ideally, Earned Value and Planned Value should be identical.

And another close relative is Actual Cost.  It is the cost the project has incurred at its current state of completion.  When Earned Value and Planned Value and Actual Cost are all equal, the planets have aligned!  But when they are not, we have discrepancies which we’ll explore below.  That may help explain the post title: “Earned Value: 50% Fiction and 50% Fact”.

The 50% fiction is Planned Value.  The 50% fact is Actual Cost.  Earned Value is somewhere in the middle.

Prototype


Here is an example of a discrepancy between Earned Value, Planned Value, and Actual Cost.  The Earned Value is much less than we expected, and the Actual Cost is much more.

Prototype


In this example, we see Earned Value at $30,000, but it should be $40,000.  We also see the actual costs on the project to be $45,000.  It turns out there are calculations to help normalize and judge the value of these numbers.  This let you compare the numbers with other projects to see how close you have come to historical numbers.  If you miss the Planned Value mark, the difference is called a variance.  Variance simply means you varied from your target by some amount.  There is a schedule variance and cost variance.  Of course ideally, we want these to be zero.

Schedule Variance (SV) is Earned Value minus Planed Value.  Cost Variance is Earned Value minus Actual Cost.  The equation is below.

SV = EV – PV  ($30,000 – $40,000 = -$10,000)

CV = EV – AC  ($30,000 – $45,000 = -$15,000)

In addition to variance, you can view the discrepancies in terms of ratios.  They are actually more helpful to compare with other projects because they normalize all the numbers to a single comparable performance value.

The Cost Performance Index is the ratio of Earned Value to Actual Cost.  The Schedule Performance Index is the ratio of Earned Value to Planned Value.

CPI = EV / AC  ($30,000 / $45,000 = .67)

SPI = EV / PV  ($30,000 / $40,000 = .75)

Any Cost Performance Index number over 1 is over budget.  Any Schedule Performance Index over 1 is “over schedule.”  See how these performance numbers could be helpful?

In this case, the Cost Performance Index is 67% efficient.  In other words, the project made 67 cents for every dollar expected.  That’s not good.  But maybe the next project will be better!