Define Gantt Chart

A Gantt chart shows you task bars, task links, milestones and summaries. Pretty good for an invention from 1910! Quickie video below.

Define Gantt Chart: A chart where the X axis is time, and the Y axis contains task start and finish dates plotted horizontally on the time axis.

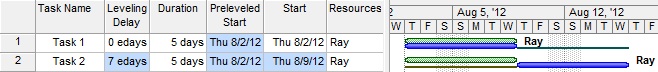
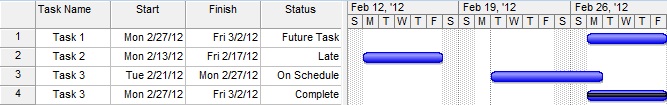
Actually, there is no Y axis. As stated above, there are just bars representing start and finish dates from scheduled tasks. Each task in the Gantt chart has a beginning and an ending dates. Those dates can be made into horizontal bars. The task start date is the left edge of the bar. The task finish date is the right edge of the bar. Each task potentially has different start and finish dates.

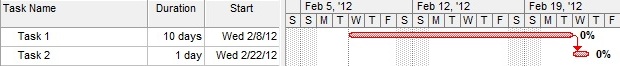
The Gantt chart itself has start and finish dates. It is small “window” into the full project schedule that has dates stretching from the beginning of the project until the end. So, you begin with the dates of a full project schedule, then look at a small part of that schedule using the Gantt chart, and inside it are individual tasks with even small increments of time, during which you’ll perform small jobs.

The Gantt chart scrolls inside the full project schedule dates. Tasks are visible in the Gantt chart “window” in the larger schedule.

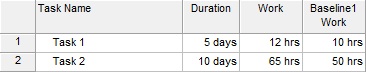
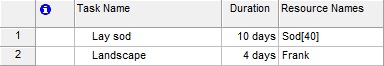
It turns out that the timesheet app named Standard Time® also has a Gantt chart. You are able to view and manage tasks in ST. Those tasks show up on the timesheet where employee enter hours. The hours they enter into the timesheet go into the “Actual work” column in ST. You can compare actual work to estimations. Plus, you see percent complete.

You can download the ST timesheet and Gantt chart here.

Define Effective Billing Rate

Your effective billing rate is how much you make per hour, even when you’re not working. Average all your revenue over all your hours, and you have the amount you’re effectively getting. Watch the video below and comment on it.

Define Effective Billing Rate: The billing rate you are actually getting when all working hours are included in the calculation of revenue divided by hours.

Here’s the deal… consultants usually can’t bill for every hour they work. They perform in-house tasks. They attend company meetings. They have admin overhead. Those are usually not billable activities, so you don’t get paid for them. You only get paid for the billable activities. So divide your total revenue by your total (billable and non-billable) hours and you have your effective billing rate.

Yikes!

Here’s an example: Say you worked 40 hours and charged $100 per hour. All the hours were billable. Your total revenue for the week is $4,000 and your effective billing rate is $100 per hour. Nice!

But what if only 30 of those hours were billable? The other 10 were admin. Your total revenue is now $3,000. $3,000 divided by 40 (total hours) is only $75 per hour.

Your effective billing rate includes admin and other non-billable time.

What is a project milestone?

Good question!  What is a project milestone?

Think of a project milestone as a marker in time where you stop and evaluate your project.

How is your project going?  Have you completed everything necessary to move on to the next level?  Have you finished everything in this milestone?  And are you ready to move forward to the next one?

The video below shows what milestones look like in a Gantt chart, and how to track time to them.  But normally you don’t actually track time to milestones.  They are just markers in time, not actual tasks.  But you can if you want to.  In fact, you could set up a project with nothing but milestones!  Just track hours to them and compare against your original estimates.  That’s a simple way to track projects.

In the old days, a milestones was a physical stone erected by the road.  There would be one stone every mile.  Just count the stones as you waked along, and you would know how far you had traveled, and how far the next town was.  They were just like our interstate mile markers now.

Project milestones are very similar.  They tell you how far into the project you have traveled.  Got a big project?  Put up a milestone every so often and you’ll know where you are.

Define: Preleveled Start

Preleveled Start: The starting dates of all tasks in a project plan before a resource leveling operation was performed.

If you use the resource leveling feature in Microsoft Project, you might consider adding the “Preleveled Start” and “Leveling Delay” columns.  These two columns help explain the effects of a leveling operation in MS Project.  The Preleveled Start field shows the dates that the tasks were before the level, and the Leveling Delay tells the amount of time each task was shifted to avoid over-allocation.

Consider the screenshots below.  They demonstrate the Preleveled Start field and Leveling Delay.

The first screenshot shows the fields before the resource leveling operation.  In this example, we have two tasks that occupy the same calendar date range.  Obviously the resource cannot complete both tasks at the same time.  We must move one, or split the tasks so they both can be completed.  But here you have a decision to make… can the resource multitask or must the second task follow only after the first has been completed?  Certain tasks like “Foundation” and “Framing” and “Roofing” cannot be multitasked.  They must be completed in sequence.  In this case, the normal leveling choices are best.

Preleveled Start before leveling
Preleveled Start is NA before leveling


In actual life, the resource will probably multitask both project tasks, which has the effect of pushing them both out.  The screenshot below shows the resource working 50% of his time on both tasks.  That doubles the amount of time the tasks take, but allows the resource the luxury to spend whatever time they want on the tasks.  This only works when the tasks are not mutually exclusive.  In other words, the second task can be performed at the same time as the first.  Or, they don’t have to be performed serially.

Resource at 50%
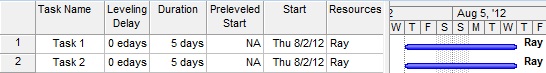
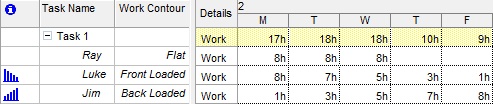
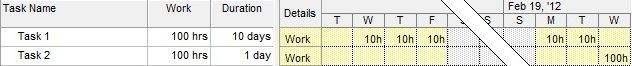
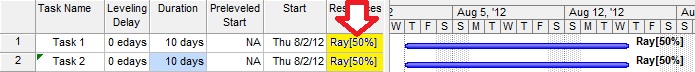
Multitasking means working both tasks during the same calendar date range


But if you really want to use resource leveling, you’ll find that MS Project pushes one task out past the first one to that it starts when the first one ends.  Use this approach when you cannot work on the second task until the first is completed.  In other words, multitasking is not possible for these two tasks.  The screenshot below illustrates this.

Preleveled Start after leveling
Results of Leveling: Preleveled Start and Leveling Delay


Follow these steps to level resources:

  • 1. Choose Tools, Level Resources…
  • 2. Click Level Now

This dialog box is displayed to help choose the leveling options.

Resource Leveling Options 

Define: Fixed Duration, Fixed Units, Fixed Work

Fixed Duration: The task calendar ‘Duration’ will not change when you change the ‘Work’ or add resources.

Fixed Units: The resource percentage of work will not change when you change the task ‘Duration’ or ‘Work’ hours.
Fixed Work: The ‘Work’ hours will not change when you change the ‘Duration’ or percentage of resource work.

Double-click on a Microsoft Project task to display the dialog box below. The field we’re describing is highlighted below: ‘Task type’.

Task Properties

The default setting for ‘Task type’ is Fixed Units. That means the percentage of resource work (Example: “Buzz[50%]”) doesn’t change when you enter a new number for the work hours. For instance, if Buzz is set to work 50% of his time, changing the amount of work won’t change that. He will still work 50% of his time.

Changing the ‘Task type’ to Fixed Duration causes the Duration field to not change when you enter ‘Work’ hours.

Changing the ‘Task type’ to Fixed Work means that the Work field won’t change when you update the other two fields.

Define: Work Contour

Work Contour: The distribution (or “shape”) of working hours over the duration of a task.

In Microsoft Project, working hours are not always spread across the duration of a task like peanut butter.  In other words, they don’t have to be evenly distributed.  They can front-loaded so that most of the work is performed at the beginning of the task.  Or, they could be back-loaded, to represent most of the work being performed at the end of the task.  In fact, there are several choices for the Work Contour.


Here they are:

  1. Flat
  2. Back-loaded
  3. Front-loaded
  4. Double peak
  5. Early peak
  6. Late peak
  7. Bell
  8. Turtle


The images below illustrate how to choose the Work Contour for each resource in each task.

First, choose View, Gantt Chart to create tasks and assign resources to them.  Then set the duration.


Next, choose View, Task Usage.  Insert the ‘Work Contour” column.  After choosing various contours for each resource, you will see an icon representing the distribution of hours across the task.  Notice how the front-loaded task has most of the hour distributed in the first few days while the back-loaded contour has them distributed at the final days.  Flat distribution is default.  It simply uses the resource schedule.

Define: Project Baseline

Project Baseline: A copy of the project tasks as they were at some point in time, which you can refer to at a later date.

Here is an example of two project tasks immediately after setting the project baseline.  Notice that the ‘Baseline 1 Work’ field has been copied from the ‘Work’ field.  As the ‘Work’ field changes throughout the project, the baseline is still available for comparison.  How did we do this?  Easy.  Just choose Tools, Tracking, Set Baseline within Microsoft Project.

Here we see the ‘Work’ field changed and the ‘Baseline’ unchanged.


Want an easier solution?
Baselining can be complicated and confusing, so “Sir Ganttalot” (a YouTube celebrity) has come up with an easy alternative.  Click here to see the YouTube video:


http://www.youtube.com/watch?v=c7BJ6%5F1pcgc

Essentially, Ganttalot creates a customized field named “Finish Date Changed” to identify tasks that have changed.  Graphical arrow indicators tell whether a finish date has slipped in the future or has tightened up.  These graphical indicators are easier to spot than comparing textual finish dates to baseline finish dates.  It shows you at-a-glance what’s changed from week to week.  Slick, I’d say!

Define: Task Status

Task Status: In Microsoft Project, the task status field represents the current state of each task.

The illustration below shows all the possible task states: Future Task, Late, On Schedule, and Complete.


How do tasks get into these states?
    1. Future Task:  When the task ‘Start’ date is in the future.
    2. Late: When the completed hours are less than what they should be by today.
    3. On Schedule: When the completed hours are >= to what they should be today.
    4. Complete: When the percent complete is 100%.

Define: Timephased

Timephased: Total project task hours distributed over a period of time.

An example from Microsoft Project of this is shown below.  The hours for each project task are distributed over the duration of each task.  The hours per day is the ‘Work’ field divided by ‘Duration’ field.  In other words, the total work is spread evenly over the duration.  Choose the Microsoft Project views below to see these task layouts.


Tracking Gantt View:


Task Usage View:
 

You can see that the 100 hours are timephased over 10 days for the first task, and over 1 day on the second task.

Define: Material resource

Material resource: A non-human, quantifyable substance assigned to project tasks.

Material resources are assigned to project tasks, but are not human resources.  They are any quantifyable material used to complete the task.  The image below illustrates.  In this example, 40 yards of sod are used in completing the “Lay sod” task.

–newshirt