Bear with me… Vicarious Goal Completion is a pretty obscure title, but there’s logic to it. 🙂
Psychologists have observed a strange human peculiarity. And it relates directly to project management. It’s called Vicarious Goal Completion. Researchers first encountered it while studying fast food menus. Can I get you to bite?
When fast food menus contain a “Salad” choice or other healthy food items, people purchase the junk food instead!
Here’s why: People who see healthy items on a menu feel good about their weight loss goals and give themselves permission to indulge a little. So, they eat the burger and fries instead. In other words, they remember eating good and believe they have already attained their goals, so that gives them permission to splurge. The goals are completed vicariously through the menu itself.
Obviously, this is just a slick way of tricking oneself into dodging responsibility. They used to call this laziness. Any excuse to pig out.
I’ve notice the same behavior with software downloads and project tasks. The ratio of downloads to form-completions is pitifully low. In other words, people take the time to fill out a download form, but never actually install and test the software. Vicarious Goal Completion! The person believes they have finished the job, when in fact, they have only just begun. Filling out the form gives them a warm fuzzy feeling about the goal of procuring software, and that warm feeling is enough to satisfy them. They don’t actually care if they download, install, and test. They have met their goals and that’s all that matters.
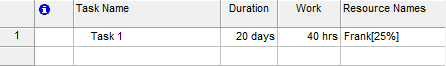
The same is true of project management. Beware of employees who start tasks, but never complete them. Once a task is started, good feelings arise. Those good feelings give the employee permission of quit because they feel they have already finished, or full completion is within sight. Vicarious Goal Completion! Nobody likes to take their project tasks to the uttermost level of completion – unless forced to do so.
–ray